런타임 프로파일링 (Capturing Profiler Stats at Runtime)
Unity로 개발을 진행하다보면 런타임 상황 / 플랫폼 및 실제 기기 에서 테스트하는 과정에서 여러가지를 개발적인 요소를 확인해야하는 상황이 종종 생긴다.
그런 과정에서 디버깅 모드로 Profiling 관련되서 바로 확인이 가능한 화면을 만들어두면 편리하다.
<ProfilerCategory.Memory>
ProfilerRecorder의 특정 항목의 Profiler의 명시된 값을 입력하면 해당 값을 읽어올수 있다.
예시는 다음과 같다.
ProfilerRecorder.StartNew(ProfilerCategory.Memory, "System Used Memory");
<테스트 코드>
using System.Collections;
using System.Collections.Generic;
using UnityEngine;
using Unity.Profiling;
using System.Text;
public class ProfilerTool : MonoBehaviour
{
string statsText;
ProfilerRecorder totalMemoryRecorder;
ProfilerRecorder systemMemoryRecorder;
ProfilerRecorder gcMemoryRecorder;
ProfilerRecorder mainThreadTimeRecorder;
ProfilerRecorder setPassCallsRecorder;
ProfilerRecorder drawCallsRecorder;
ProfilerRecorder verticesRecorder;
ProfilerRecorder fpsRecorder;
float deltaTime = 0.0f;
static double GetRecorderFrameAverage(ProfilerRecorder recorder)
{
var samplesCount = recorder.Capacity;
if (samplesCount == 0)
return 0;
double r = 0;
unsafe
{
var samples = stackalloc ProfilerRecorderSample[samplesCount];
recorder.CopyTo(samples, samplesCount);
for (var i = 0; i < samplesCount; ++i)
r += samples[i].Value;
r /= samplesCount;
}
return r;
}
void OnEnable()
{
systemMemoryRecorder = ProfilerRecorder.StartNew(ProfilerCategory.Memory, "System Used Memory");
totalMemoryRecorder = ProfilerRecorder.StartNew(ProfilerCategory.Memory, "Total Used Memory");
gcMemoryRecorder = ProfilerRecorder.StartNew(ProfilerCategory.Memory, "GC Reserved Memory");
mainThreadTimeRecorder = ProfilerRecorder.StartNew(ProfilerCategory.Internal, "Main Thread", 15);
fpsRecorder = ProfilerRecorder.StartNew(ProfilerCategory.Render, "FPS");
setPassCallsRecorder = ProfilerRecorder.StartNew(ProfilerCategory.Render, "SetPass Calls Count");
drawCallsRecorder = ProfilerRecorder.StartNew(ProfilerCategory.Render, "Draw Calls Count");
verticesRecorder = ProfilerRecorder.StartNew(ProfilerCategory.Render, "Vertices Count");
}
void OnDisable()
{
totalMemoryRecorder.Dispose();
systemMemoryRecorder.Dispose();
gcMemoryRecorder.Dispose();
fpsRecorder.Dispose();
mainThreadTimeRecorder.Dispose();
setPassCallsRecorder.Dispose();
drawCallsRecorder.Dispose();
verticesRecorder.Dispose();
}
void Update()
{
var sb = new StringBuilder(500);
if (setPassCallsRecorder.Valid)
sb.AppendLine($"SetPass Calls: {setPassCallsRecorder.LastValue}");
if (drawCallsRecorder.Valid)
sb.AppendLine($"Draw Calls: {drawCallsRecorder.LastValue}");
if (verticesRecorder.Valid)
sb.AppendLine($"Vertices: {verticesRecorder.LastValue}");
deltaTime +=(Time.unscaledDeltaTime-deltaTime)*0.1f;
float mesc = deltaTime * 1000.0f;
float fps = 1.0f/ deltaTime;
string text =string.Format("{0:0.0} ms ({1:0.} fps)", mesc,fps);
sb.AppendLine($"Frame Time (calc) :{text}");
sb.AppendLine($"Frame Time: {GetRecorderFrameAverage(mainThreadTimeRecorder) * (1e-6f):F1} ms");
sb.AppendLine($"GC Memory: {gcMemoryRecorder.LastValue / (1024 * 1024)} MB");
sb.AppendLine($"System Memory: {systemMemoryRecorder.LastValue / (1024 * 1024)} MB");
sb.AppendLine($"Total Memory: {totalMemoryRecorder.LastValue / (1024 * 1024)} MB");
statsText = sb.ToString();
}
void OnGUI()
{
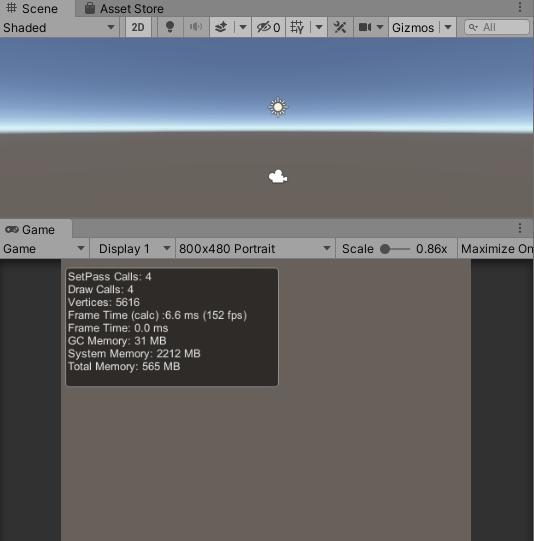
GUI.TextArea(new Rect(5, 10, 250, 20*7), statsText);
}
}각자 개발하는 카테고리에 따라 다르지만
게임 쪽에서는 대부분 메모리 영역과 랜더링 영역을 주로 많이 프로파일링 하게된다.
프로파일링 정보를 알게되면 조금이라도 퍼포먼스에 대해서 확인을 할수 있어서 유용하다.
Unity Doc Memory Profiler module (Memory 값) : [ 링크 ]
Memory Profiler module - Unity 매뉴얼
There are two ways of analyzing memory usage in your application in Unity:
docs.unity3d.com
Unity Doc Rendering Profiler module(Rendering 값) : [ 링크 ]
Rendering Profiler module - Unity 매뉴얼
The Rendering Profiler displays rendering statistics and information about what the CPU and GPU do to render the Scene. You can use these statistics to measure the resource intensity of different areas of the Scene, which is useful for optimization.
docs.unity3d.com
Unity Doc ProfilerRecorder.StartNew : [ 링크 ]
Unity - Scripting API: Unity.Profiling.ProfilerRecorder.StartNew
Success! Thank you for helping us improve the quality of Unity Documentation. Although we cannot accept all submissions, we do read each suggested change from our users and will make updates where applicable. Close
docs.unity3d.com
capturing-profiler-stats-at-runtime : [링크]
Capturing Profiler Stats at Runtime
Learn how to get precise performance metrics when your project runs on the target device. In this session we use Unity 2020.2’s runtime ProfilerRecorder API to display in-game stats like draw calls.
resources.unity.com
★★★★☆
'개발 > Unity' 카테고리의 다른 글
| Unity) GUI(IMGUI) 해상도 고정하기 (0) | 2021.06.28 |
|---|---|
| Unity)google-play-plugins (In App Review 적용하기) (0) | 2021.06.22 |
| Unity)해결) error CS0227: Unsafe code may only appear if compiling with /unsafe. Enable "Allow 'unsafe' code" in Player Settings to fix this error. (0) | 2021.06.20 |
| Unity) Field Of View / Light Shadow ( 후레쉬 효과 / 시야각) (2) | 2021.06.09 |
| Unity) 와이어 프레임(Wireframe) (0) | 2021.06.04 |


댓글